Current Issues
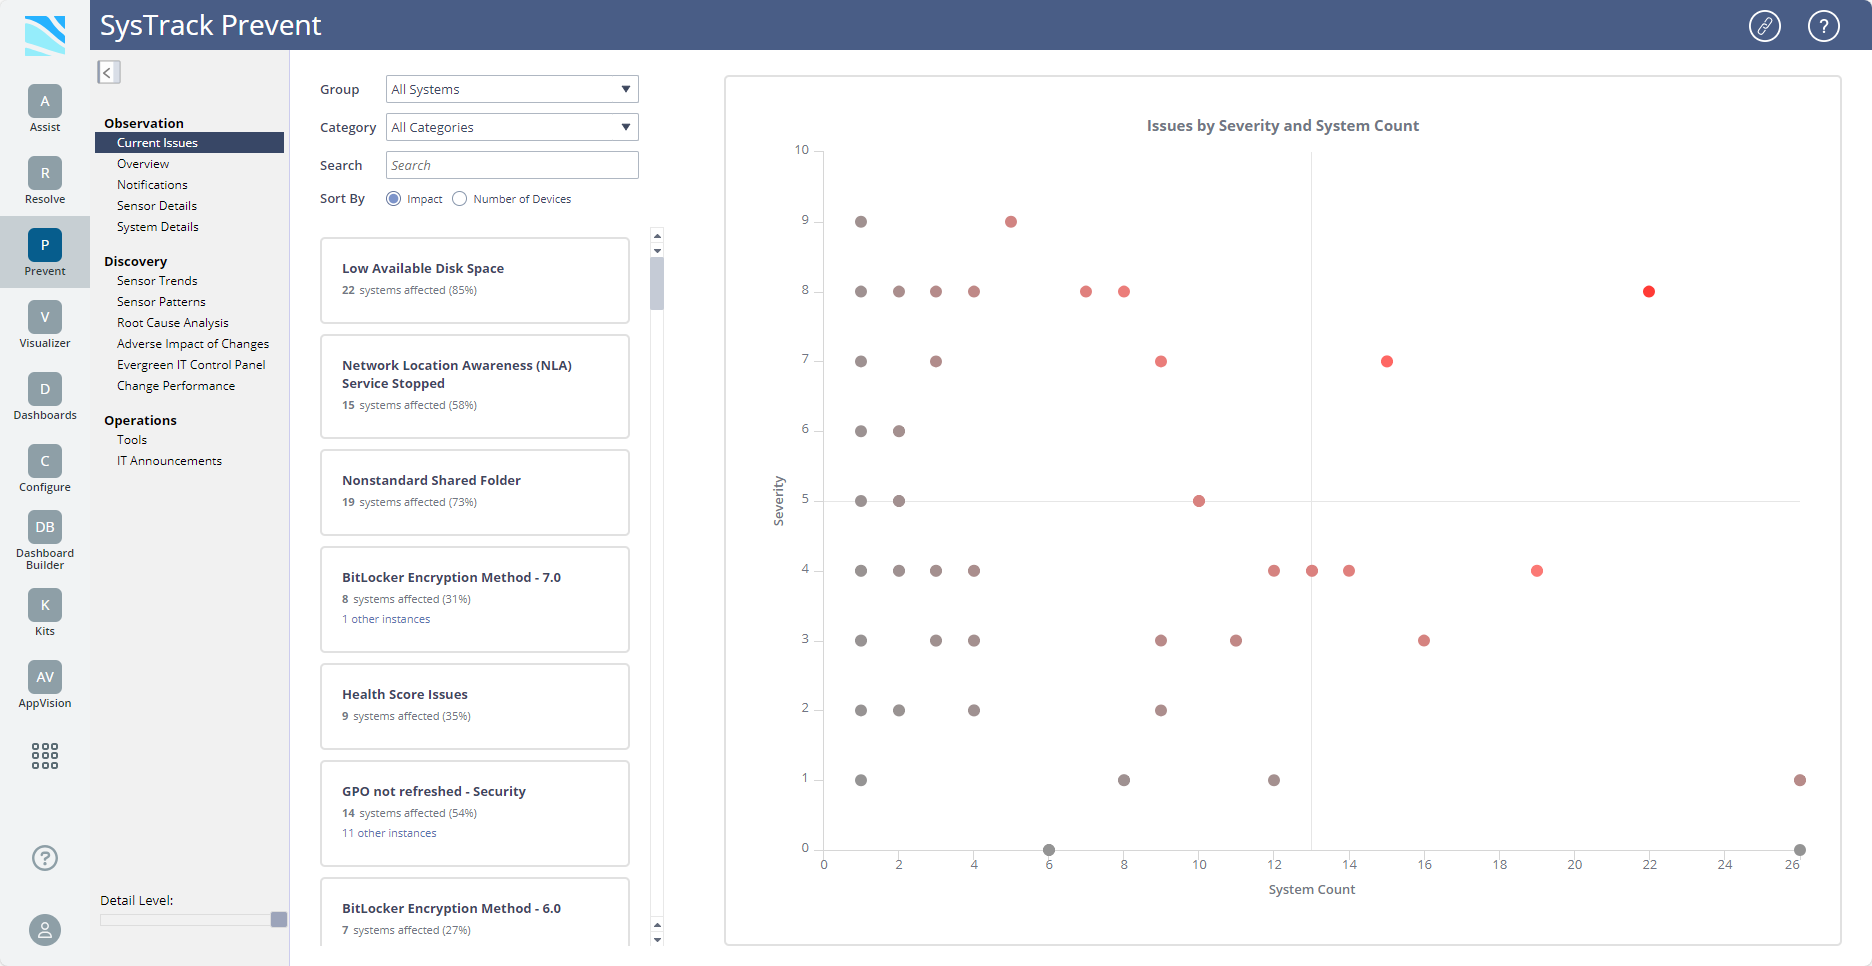
The Current Issues page is the default start of your Prevent workflow by highlighting the top sensors requiring attention in your environment. Issues are represented by graph points indicating severity and system count and are also listed along the left side of the page.
The greater the severity and number of systems affected, the deeper the color of the graph point.
Each sensor in the list displays the number of systems affected and the percentage of systems that are affected.
For details about running a tool in Prevent, see Prevent's Tools Page.
Filter, Sort, and Search
-
In Group, select a group.
-
In Category, select a category. This step is optional. You can leave the default All Categories selected.
-
Zoom in on an area of the graph by holding your mouse down and dragging.
-
In Search, enter a specific system name.
-
In Sort By, choose one of the following:
-
Impact
-
Number of Devices
-
The graph updates to display the settings you selected.
Select a Sensor

-
Do one of the following:
-
In the left panel, select a sensor.
-
Hover over a graph point to see the issue represented and then click it to view details.
-
-
The right side updates to display a description, geographic location(s), and a historical graph showing how many systems have been impacted in the past 7 days or, if you click 30d, the past 30 days. From this view you can also add a sensor note.
-
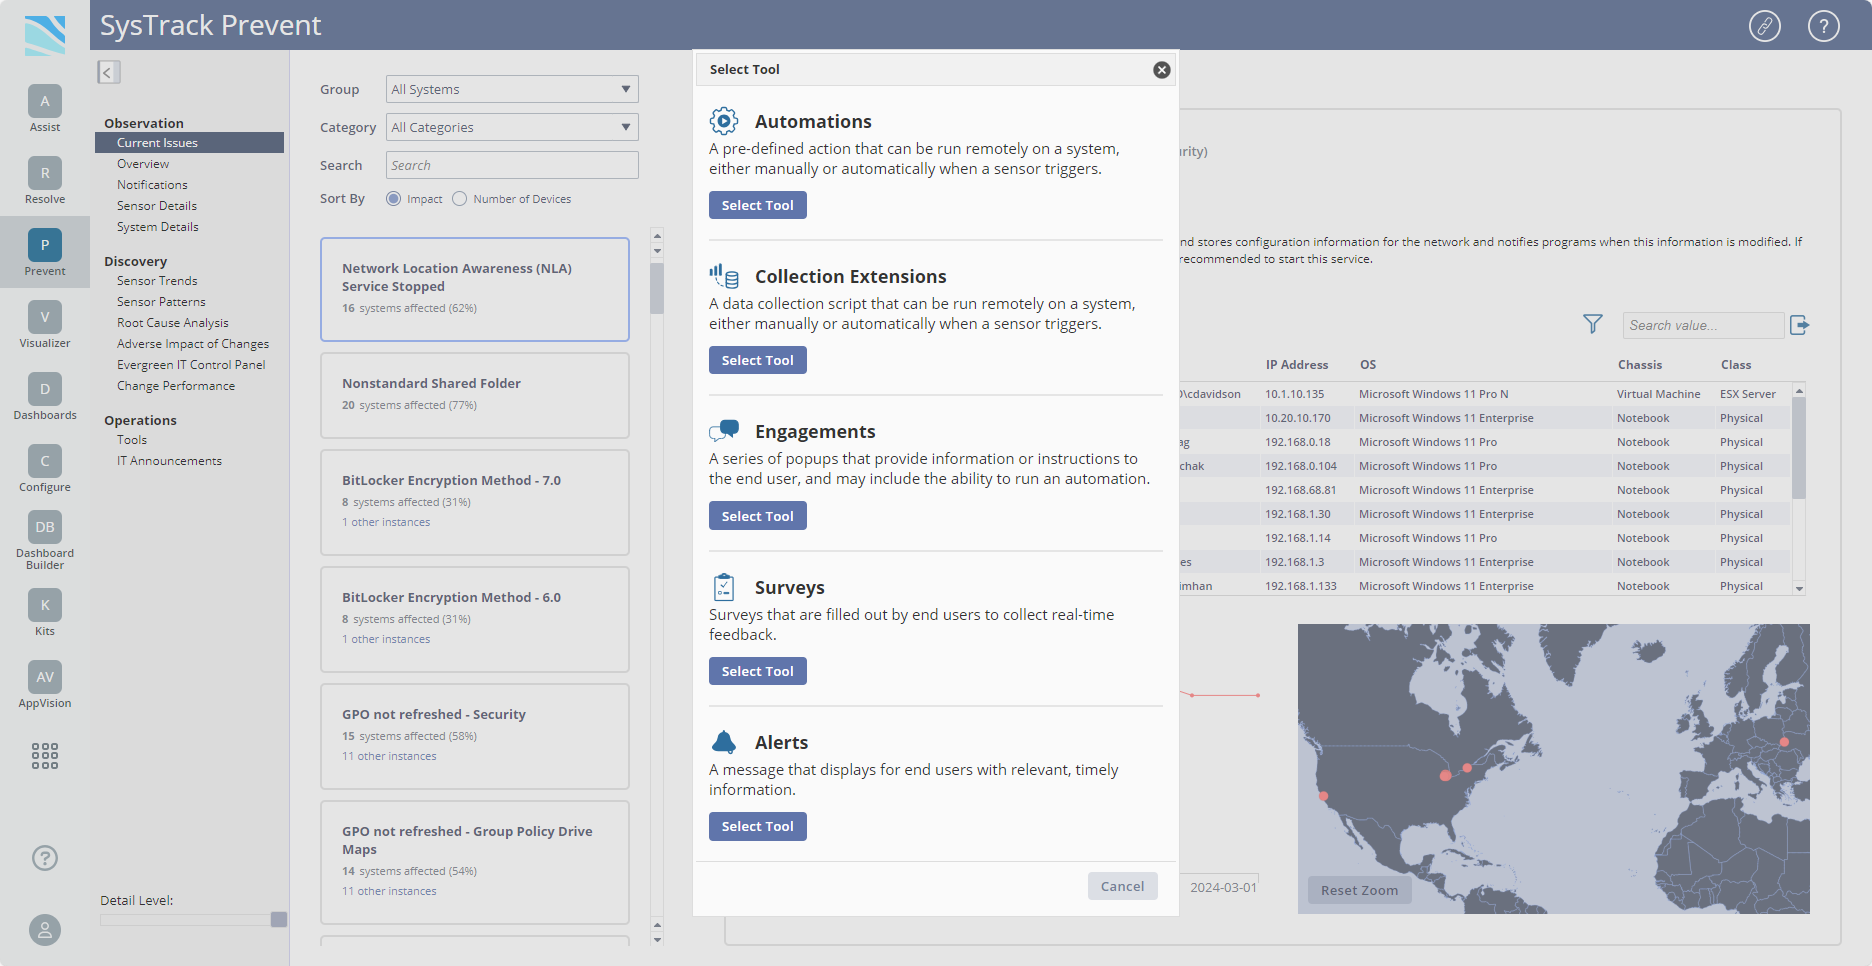
Select systems from the list and click Take Action. The Select Tool dialog box displays.
-
Select a tool from the list. For more information, see Prevent's Tools Page.
-
Select the back button to return to the main graph.
On This Page